wetlands area in hectares for Rarotonga in csv format
Figure 113: Total finfish density inside reef, 2007. (PROCFish 2009)
Sea cucumber densities (count per area) from four islands in Cook Islands, 2013. (Rongo et al, 2014)
Sea cucumber densities (count per area) from four islands in Cook Islands, 2013. (Rongo et al, 2014)
Figure 47: Dominant sources of GHGs in the Cook Islands, 2006. (Cook Islands Second National Communication under the UNFCCC, 2011)
Food and live animals imported and exported 2005-2013
Monthly sea level for Rarotonga 1993-2014
Forest Area from Source: Oliver, W. 1999 in FAO Global Forest Resource Assessment 2010, Cook Islands.
Data sheet Import and Export values for Agriculture products, 1961 to 2011
Medicinal Use of Plants Cook Islands 2016 or older
The csv file contains an overview of all terrestrial and marine protected areas in the Cook Islands as of August 2019 from the WDPA.
Map of the protected areas for Cook Islands with country-level summary statistics on the amount of area under protection, count for each type of protected area (terrestrial or marine), and the count of their designation.
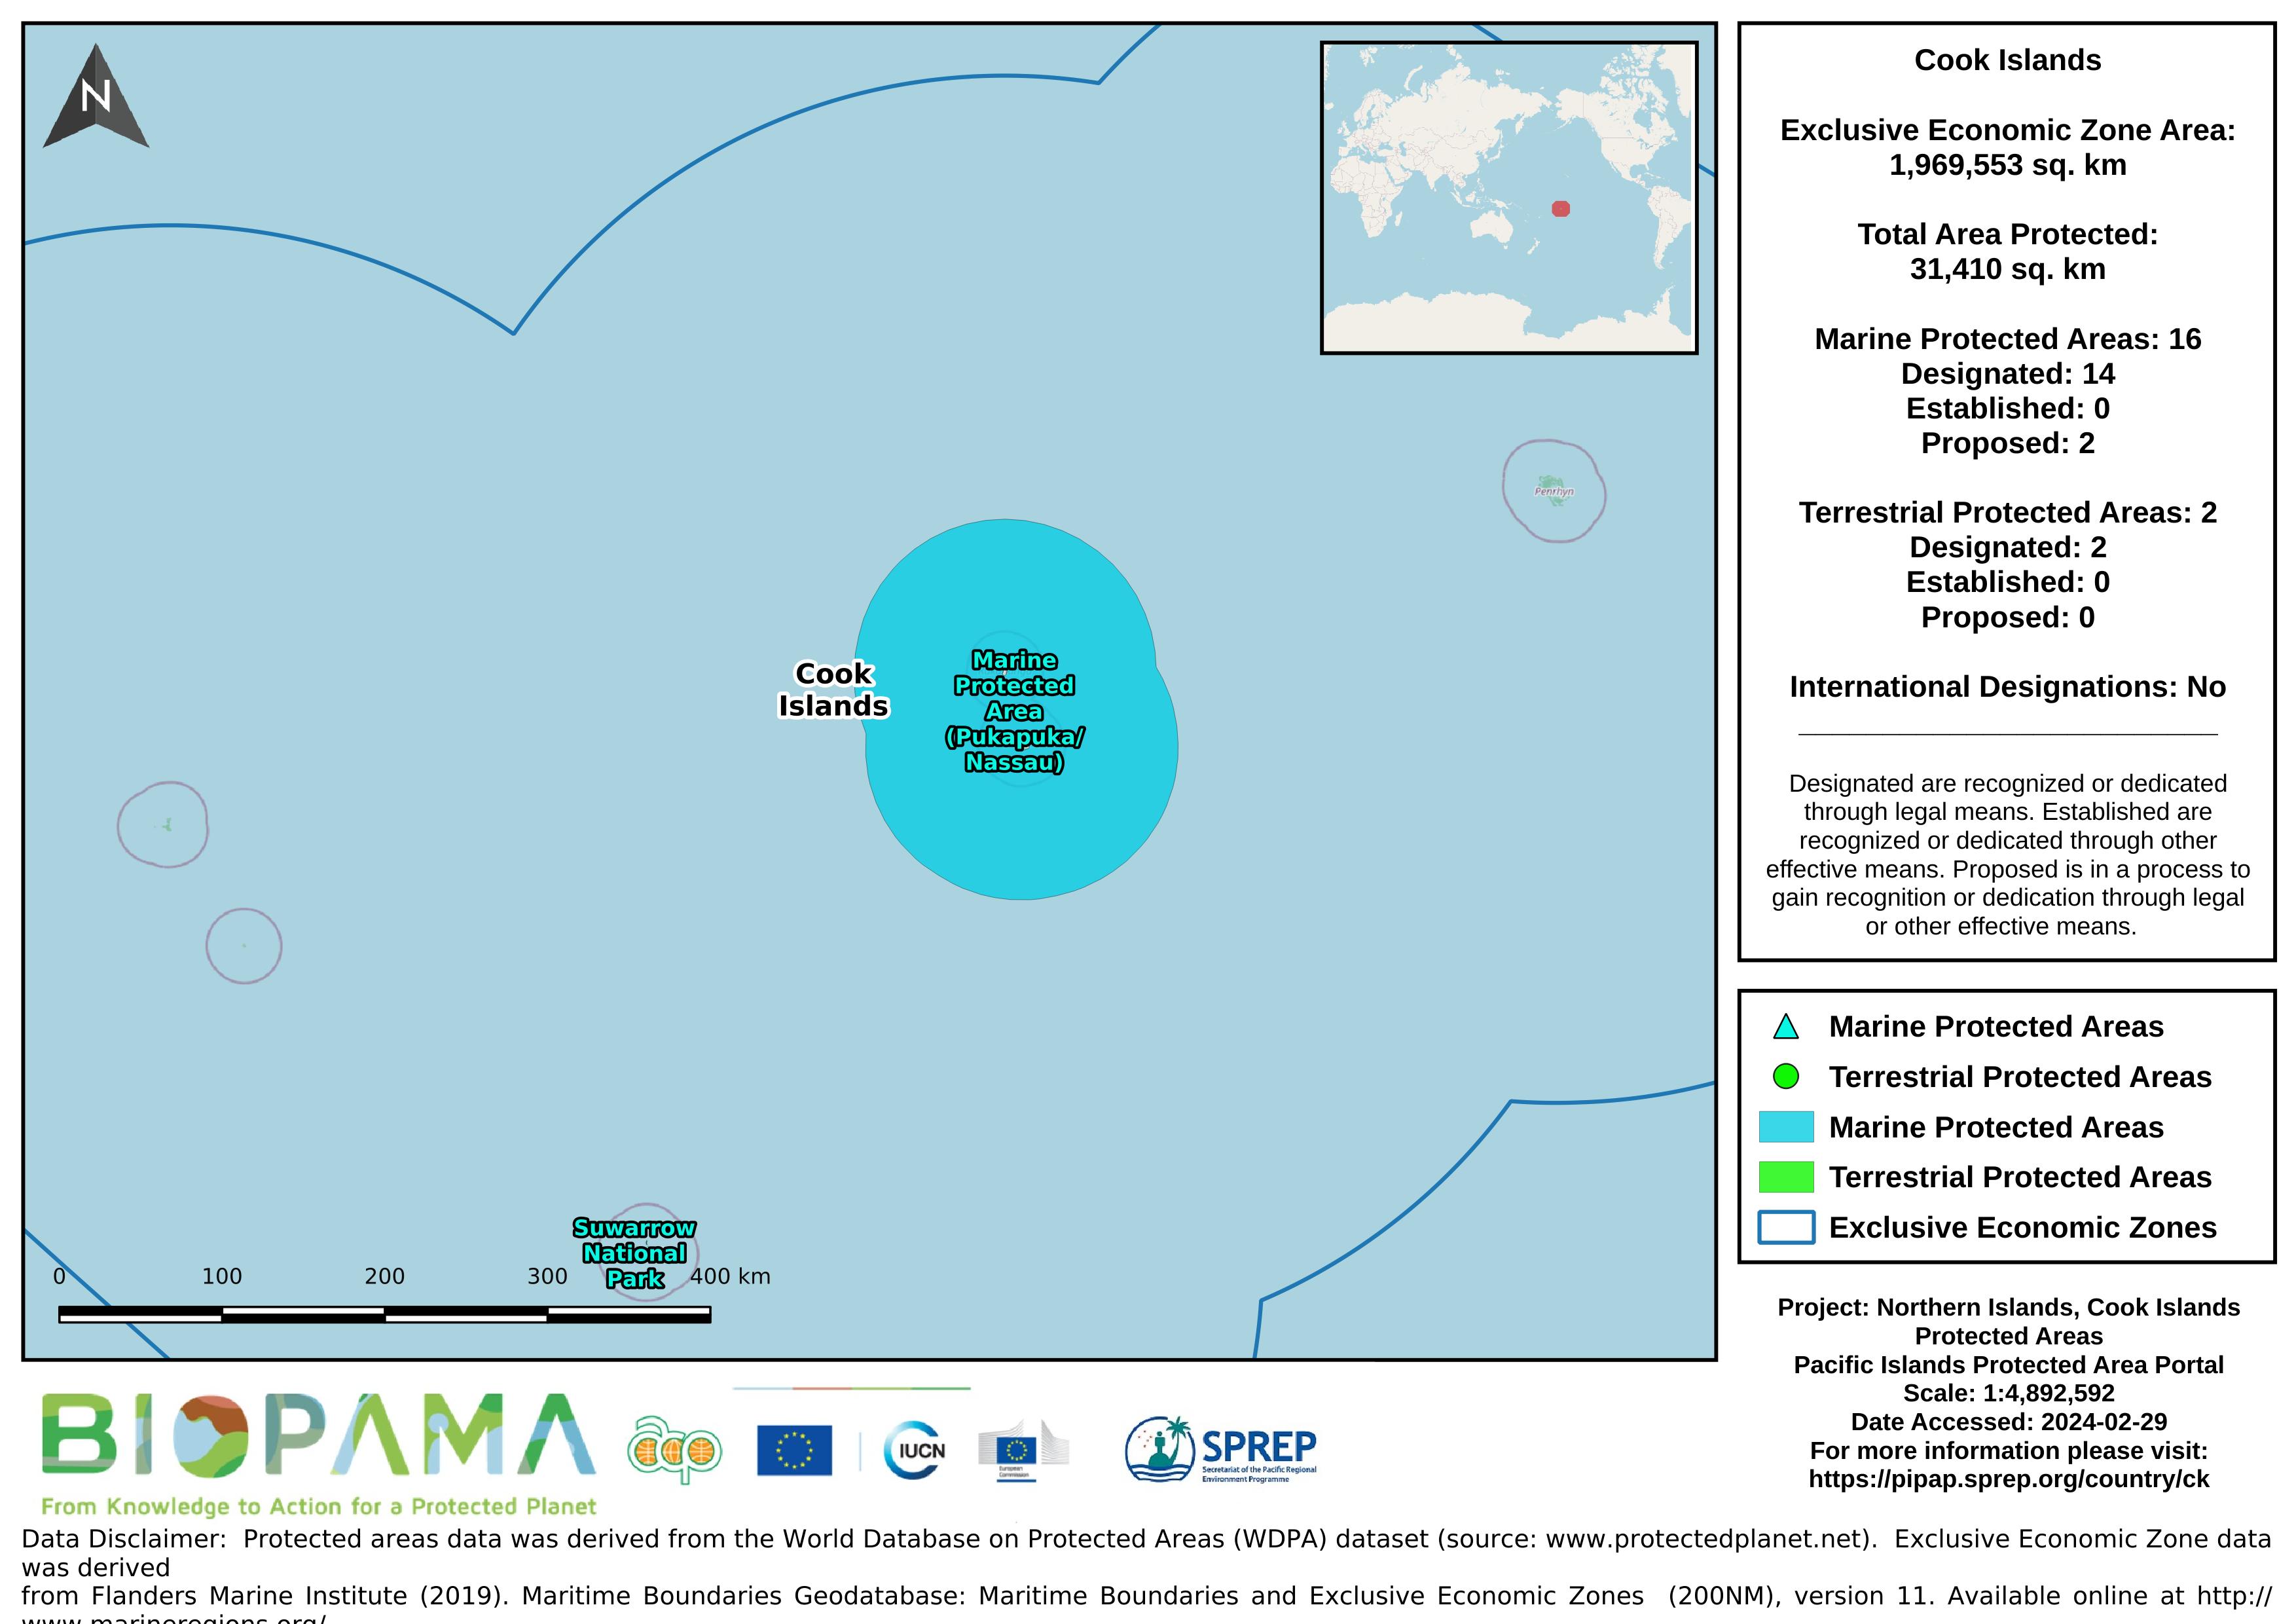
Map of the protected areas for Northern Islands, Cook Islands with country-level summary statistics on the amount of area under protection, count for each type of protected area (terrestrial or marine), and the count of their designation.
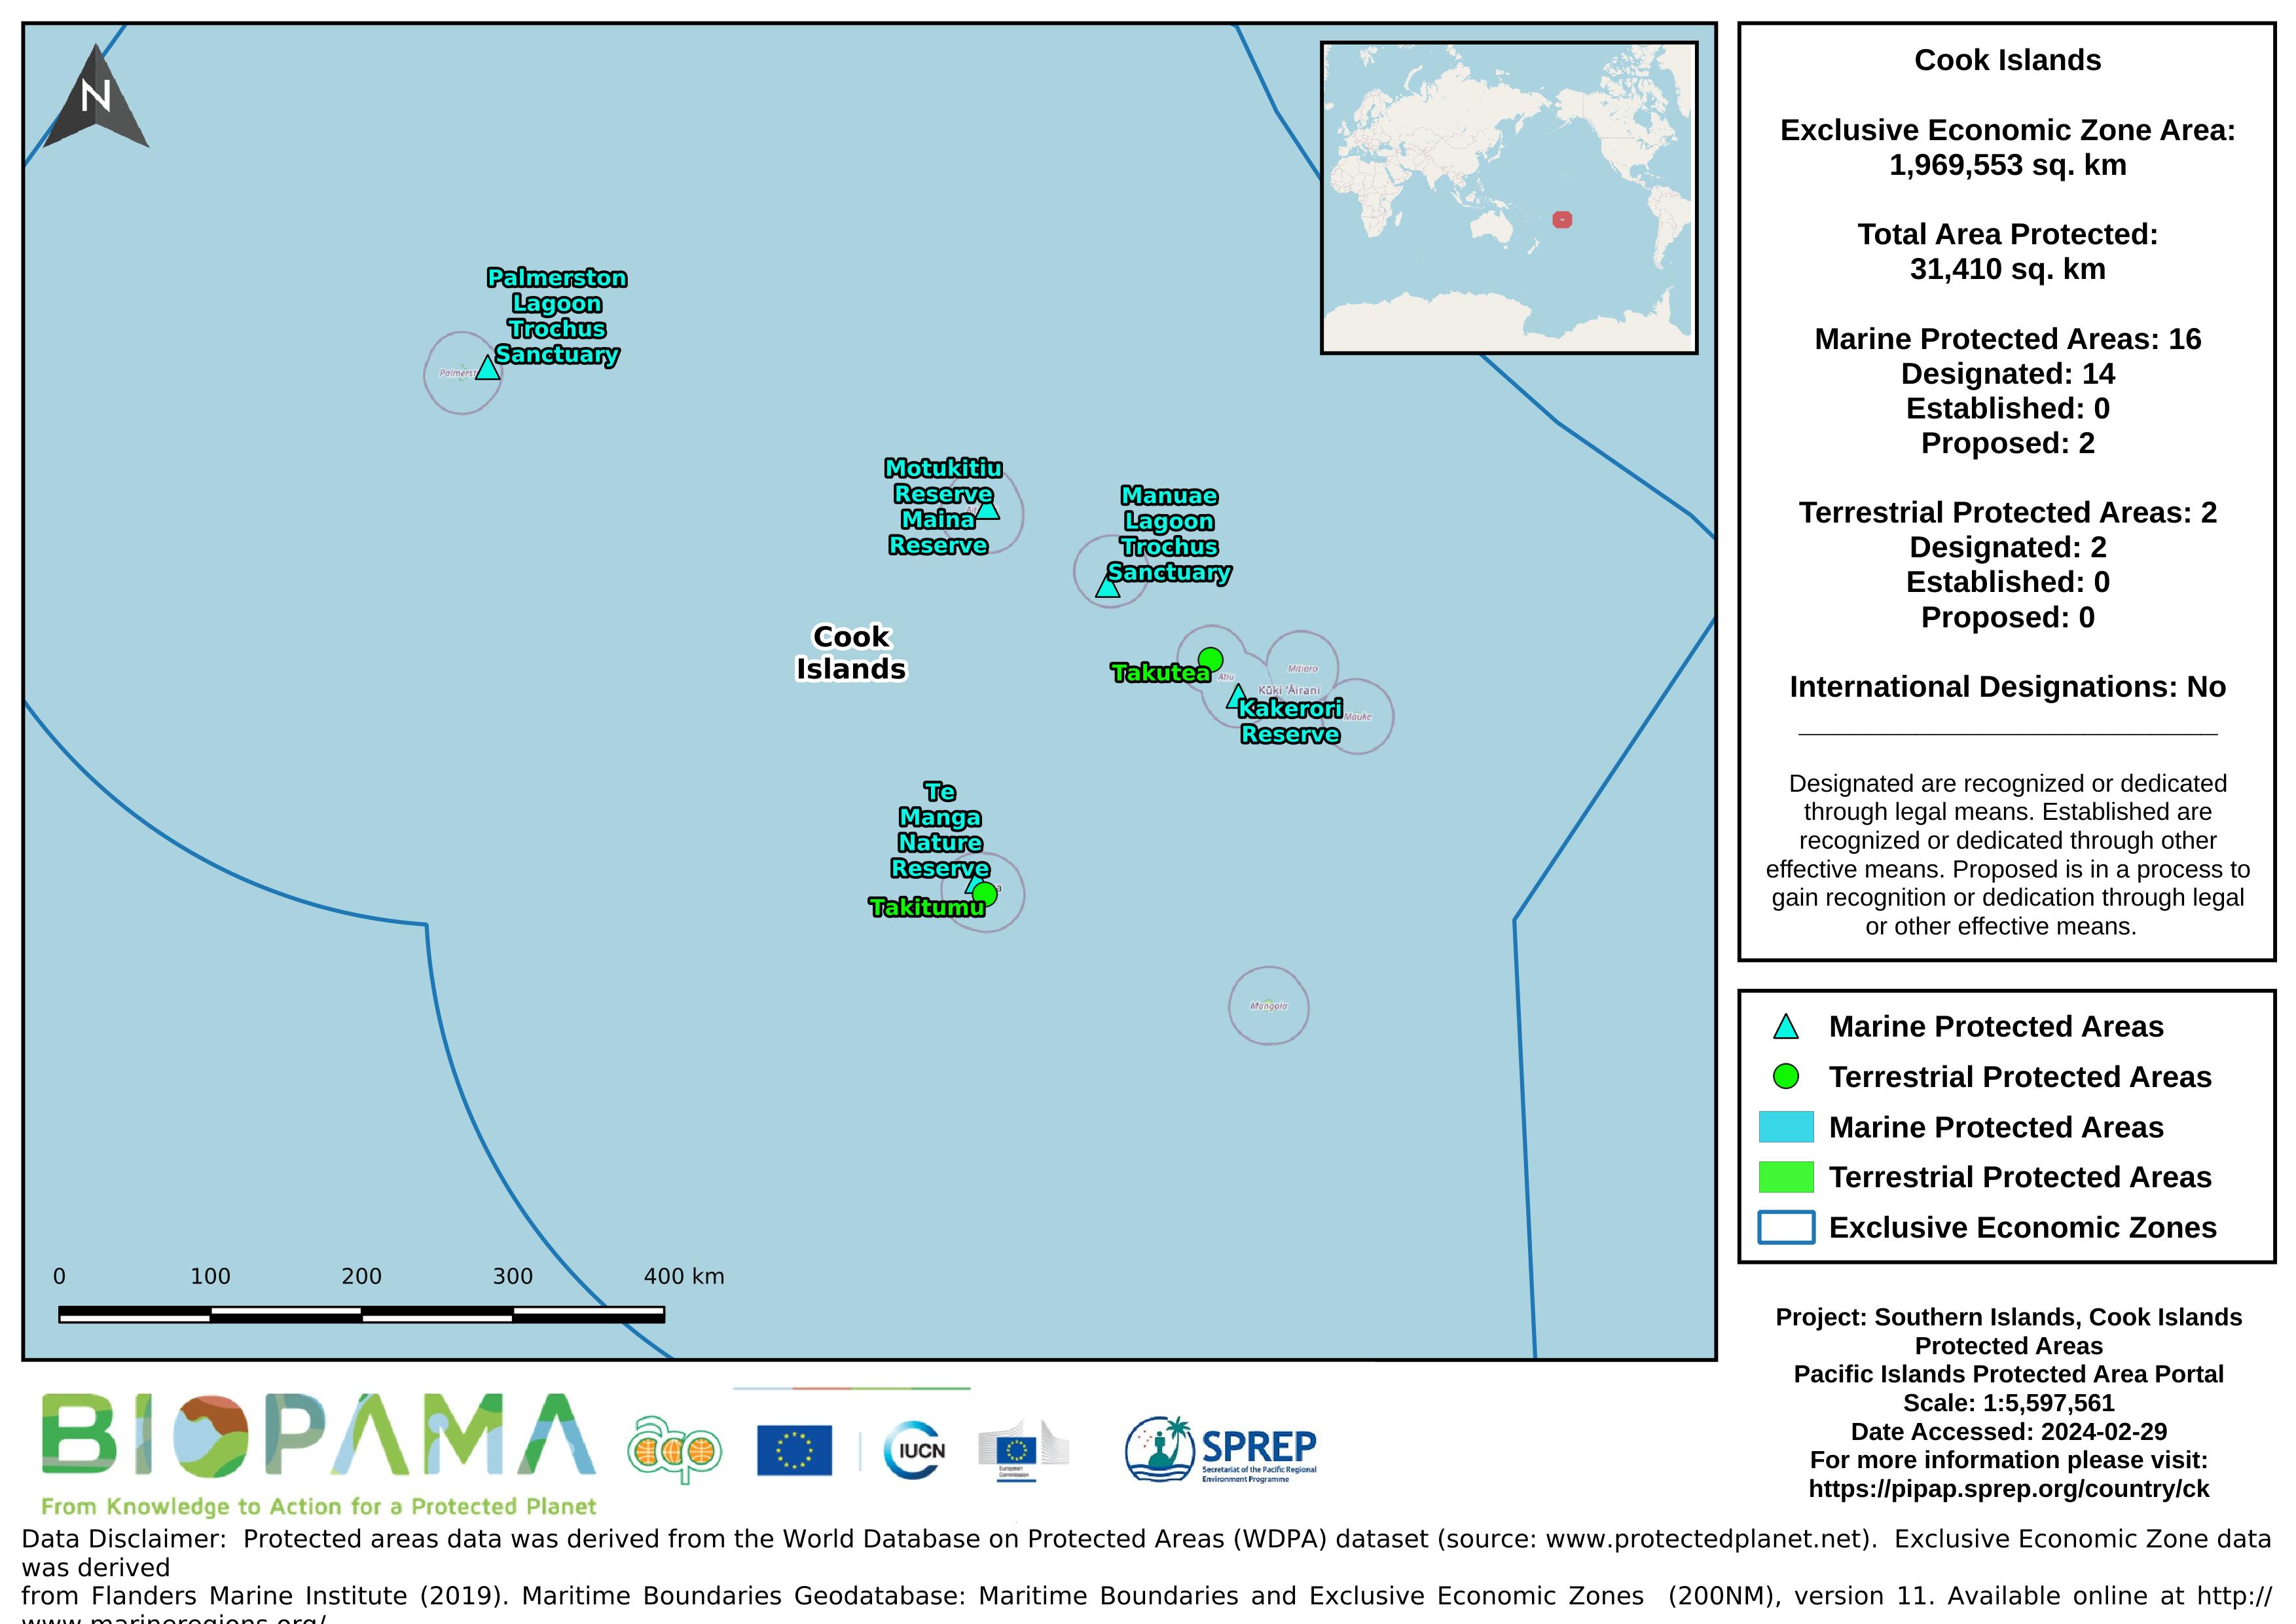
Map of the protected areas for Southern Islands, Cook Islands with country-level summary statistics on the amount of area under protection, count for each type of protected area (terrestrial or marine), and the count of their designation.
CSV file containing the global distribution of hydrothermal vent fields in WGS84 coordinate system.