Traditional leaders, Island Councils, communities and government have all contributed to the establishment and management of PAs. Most Cook Islands PAs are not covered by legislation, and the few that are legislated vary in their levels of protection. Only three of the 14 terrestrial PAs are covered by formal government-based legislations and regulations, which include the Suwarrow National Park Declaration, Takutea Island Regulations and Takuvaine Water Catchment Regulations.
Map of the protected areas for Cook Islands with country-level summary statistics on the amount of area under protection, count for each type of protected area (terrestrial or marine), and the count of their designation.
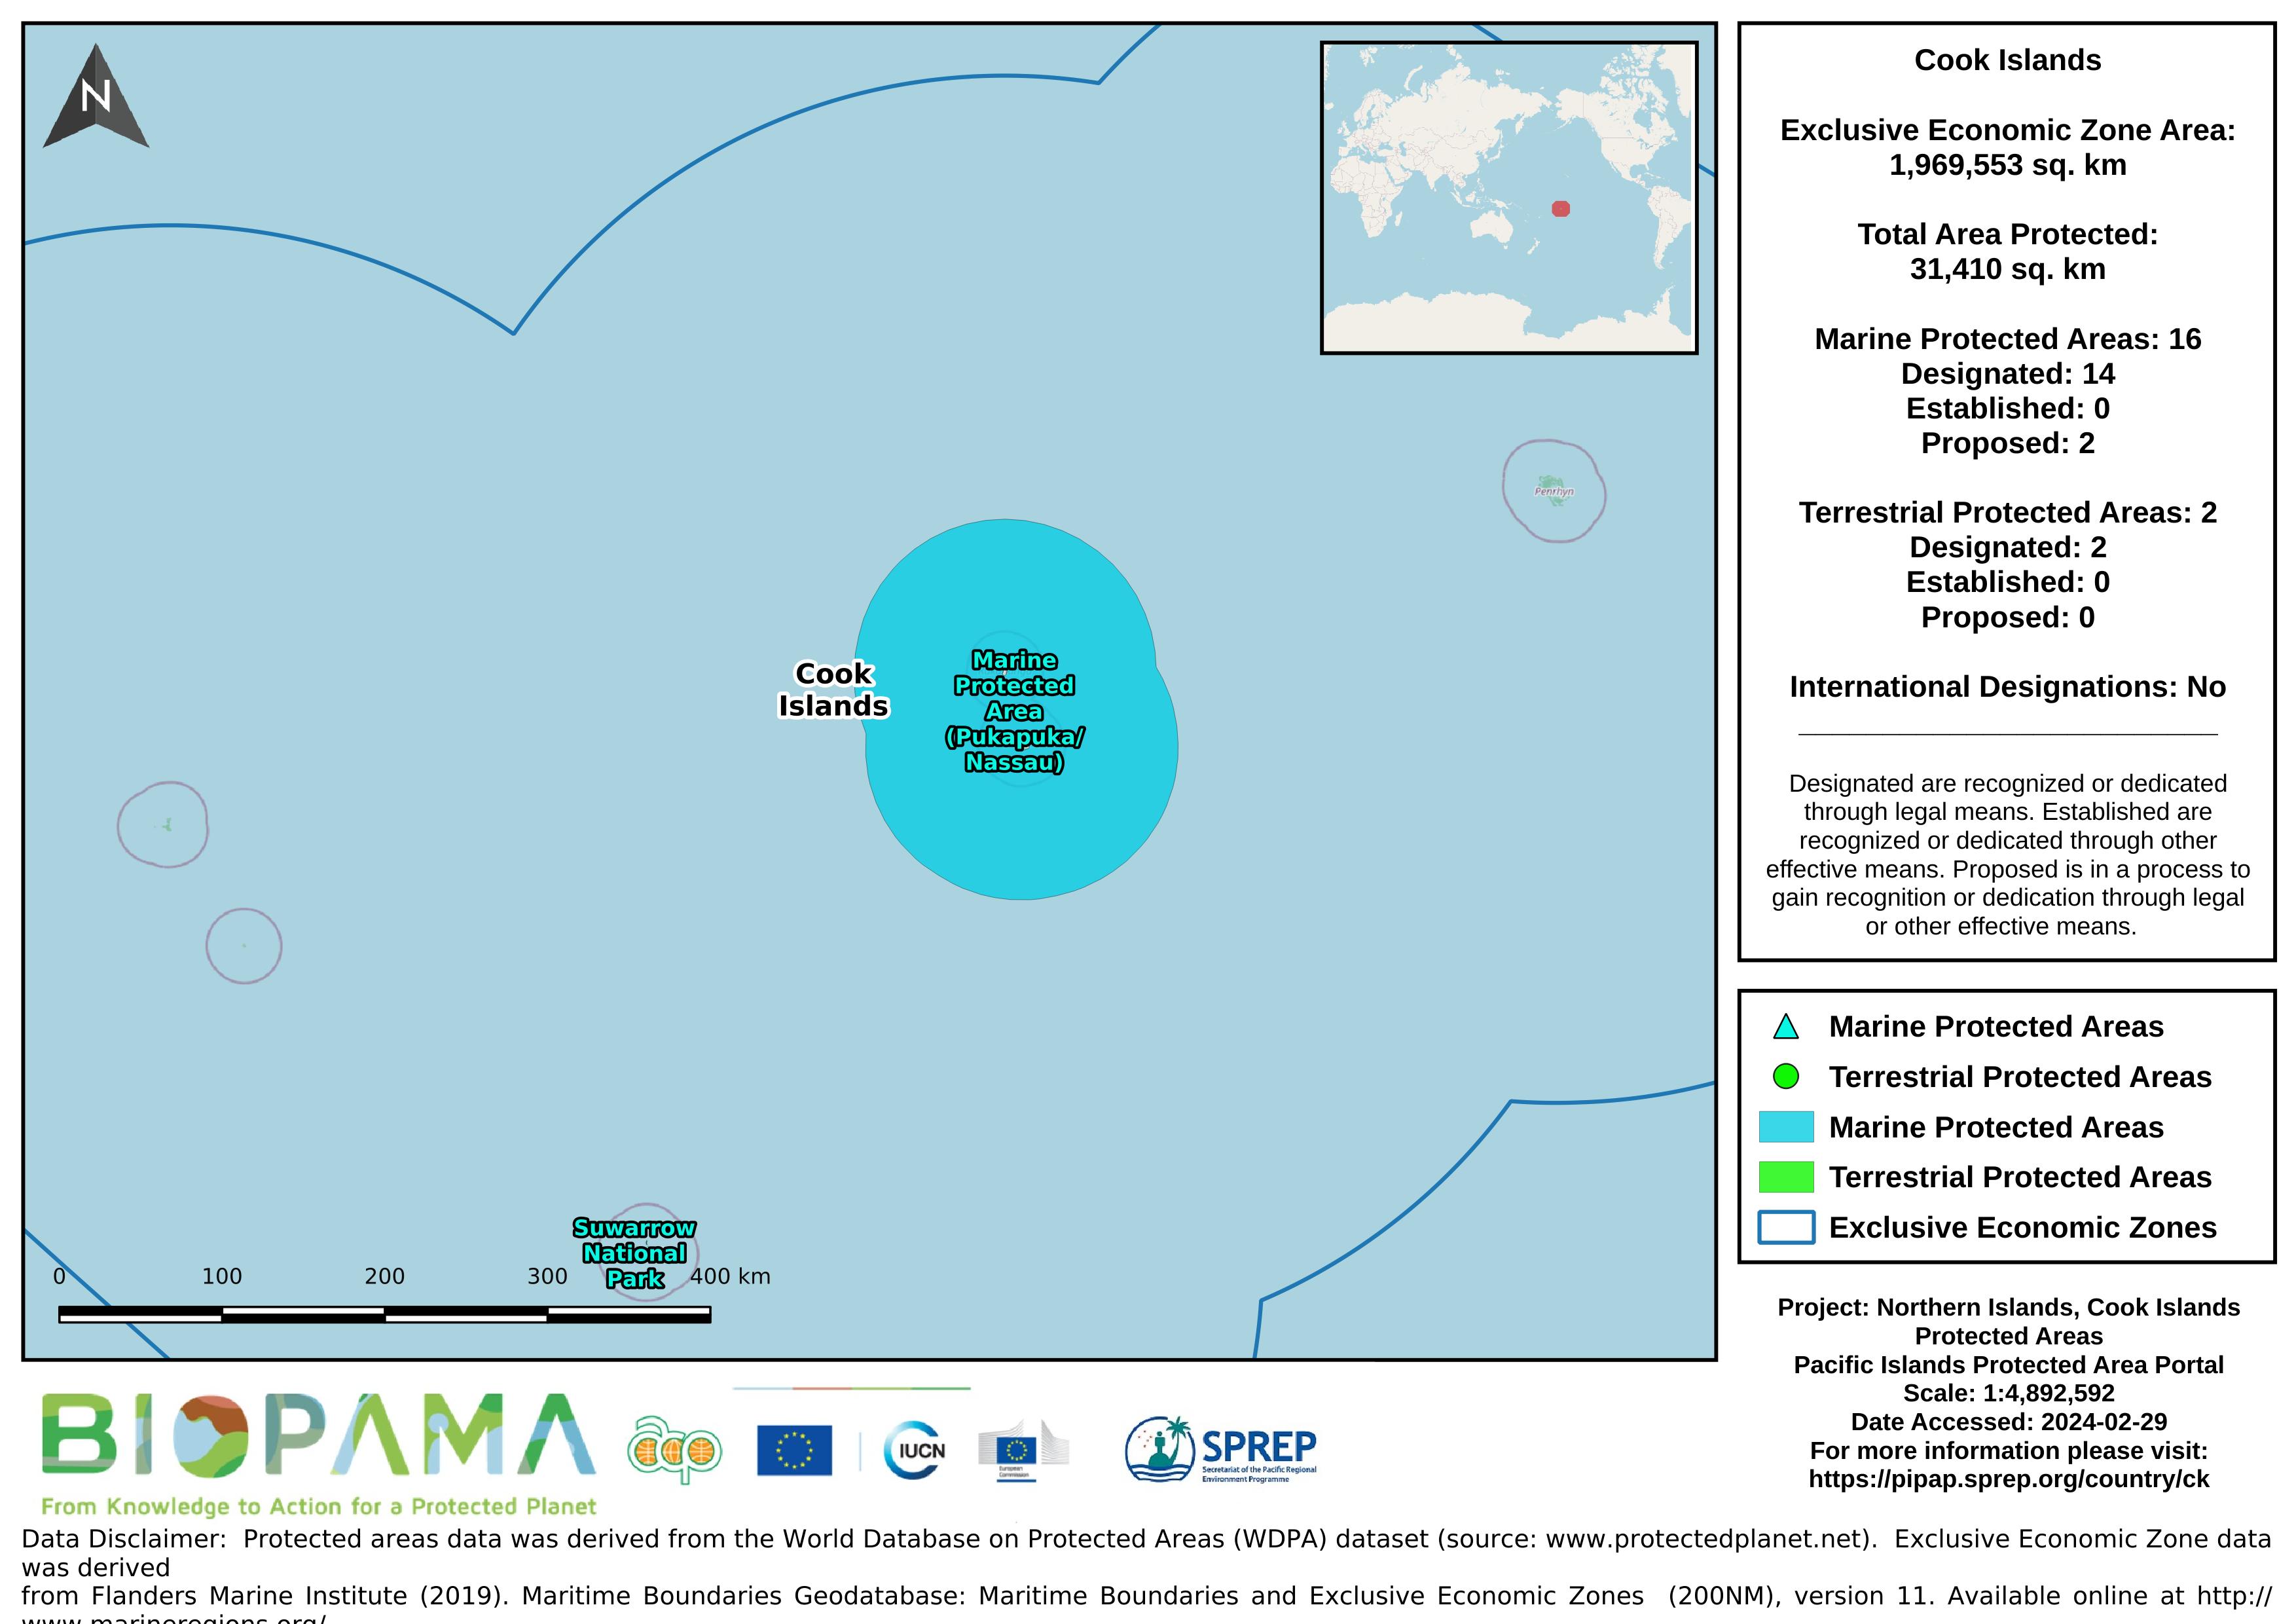
Map of the protected areas for Northern Islands, Cook Islands with country-level summary statistics on the amount of area under protection, count for each type of protected area (terrestrial or marine), and the count of their designation.
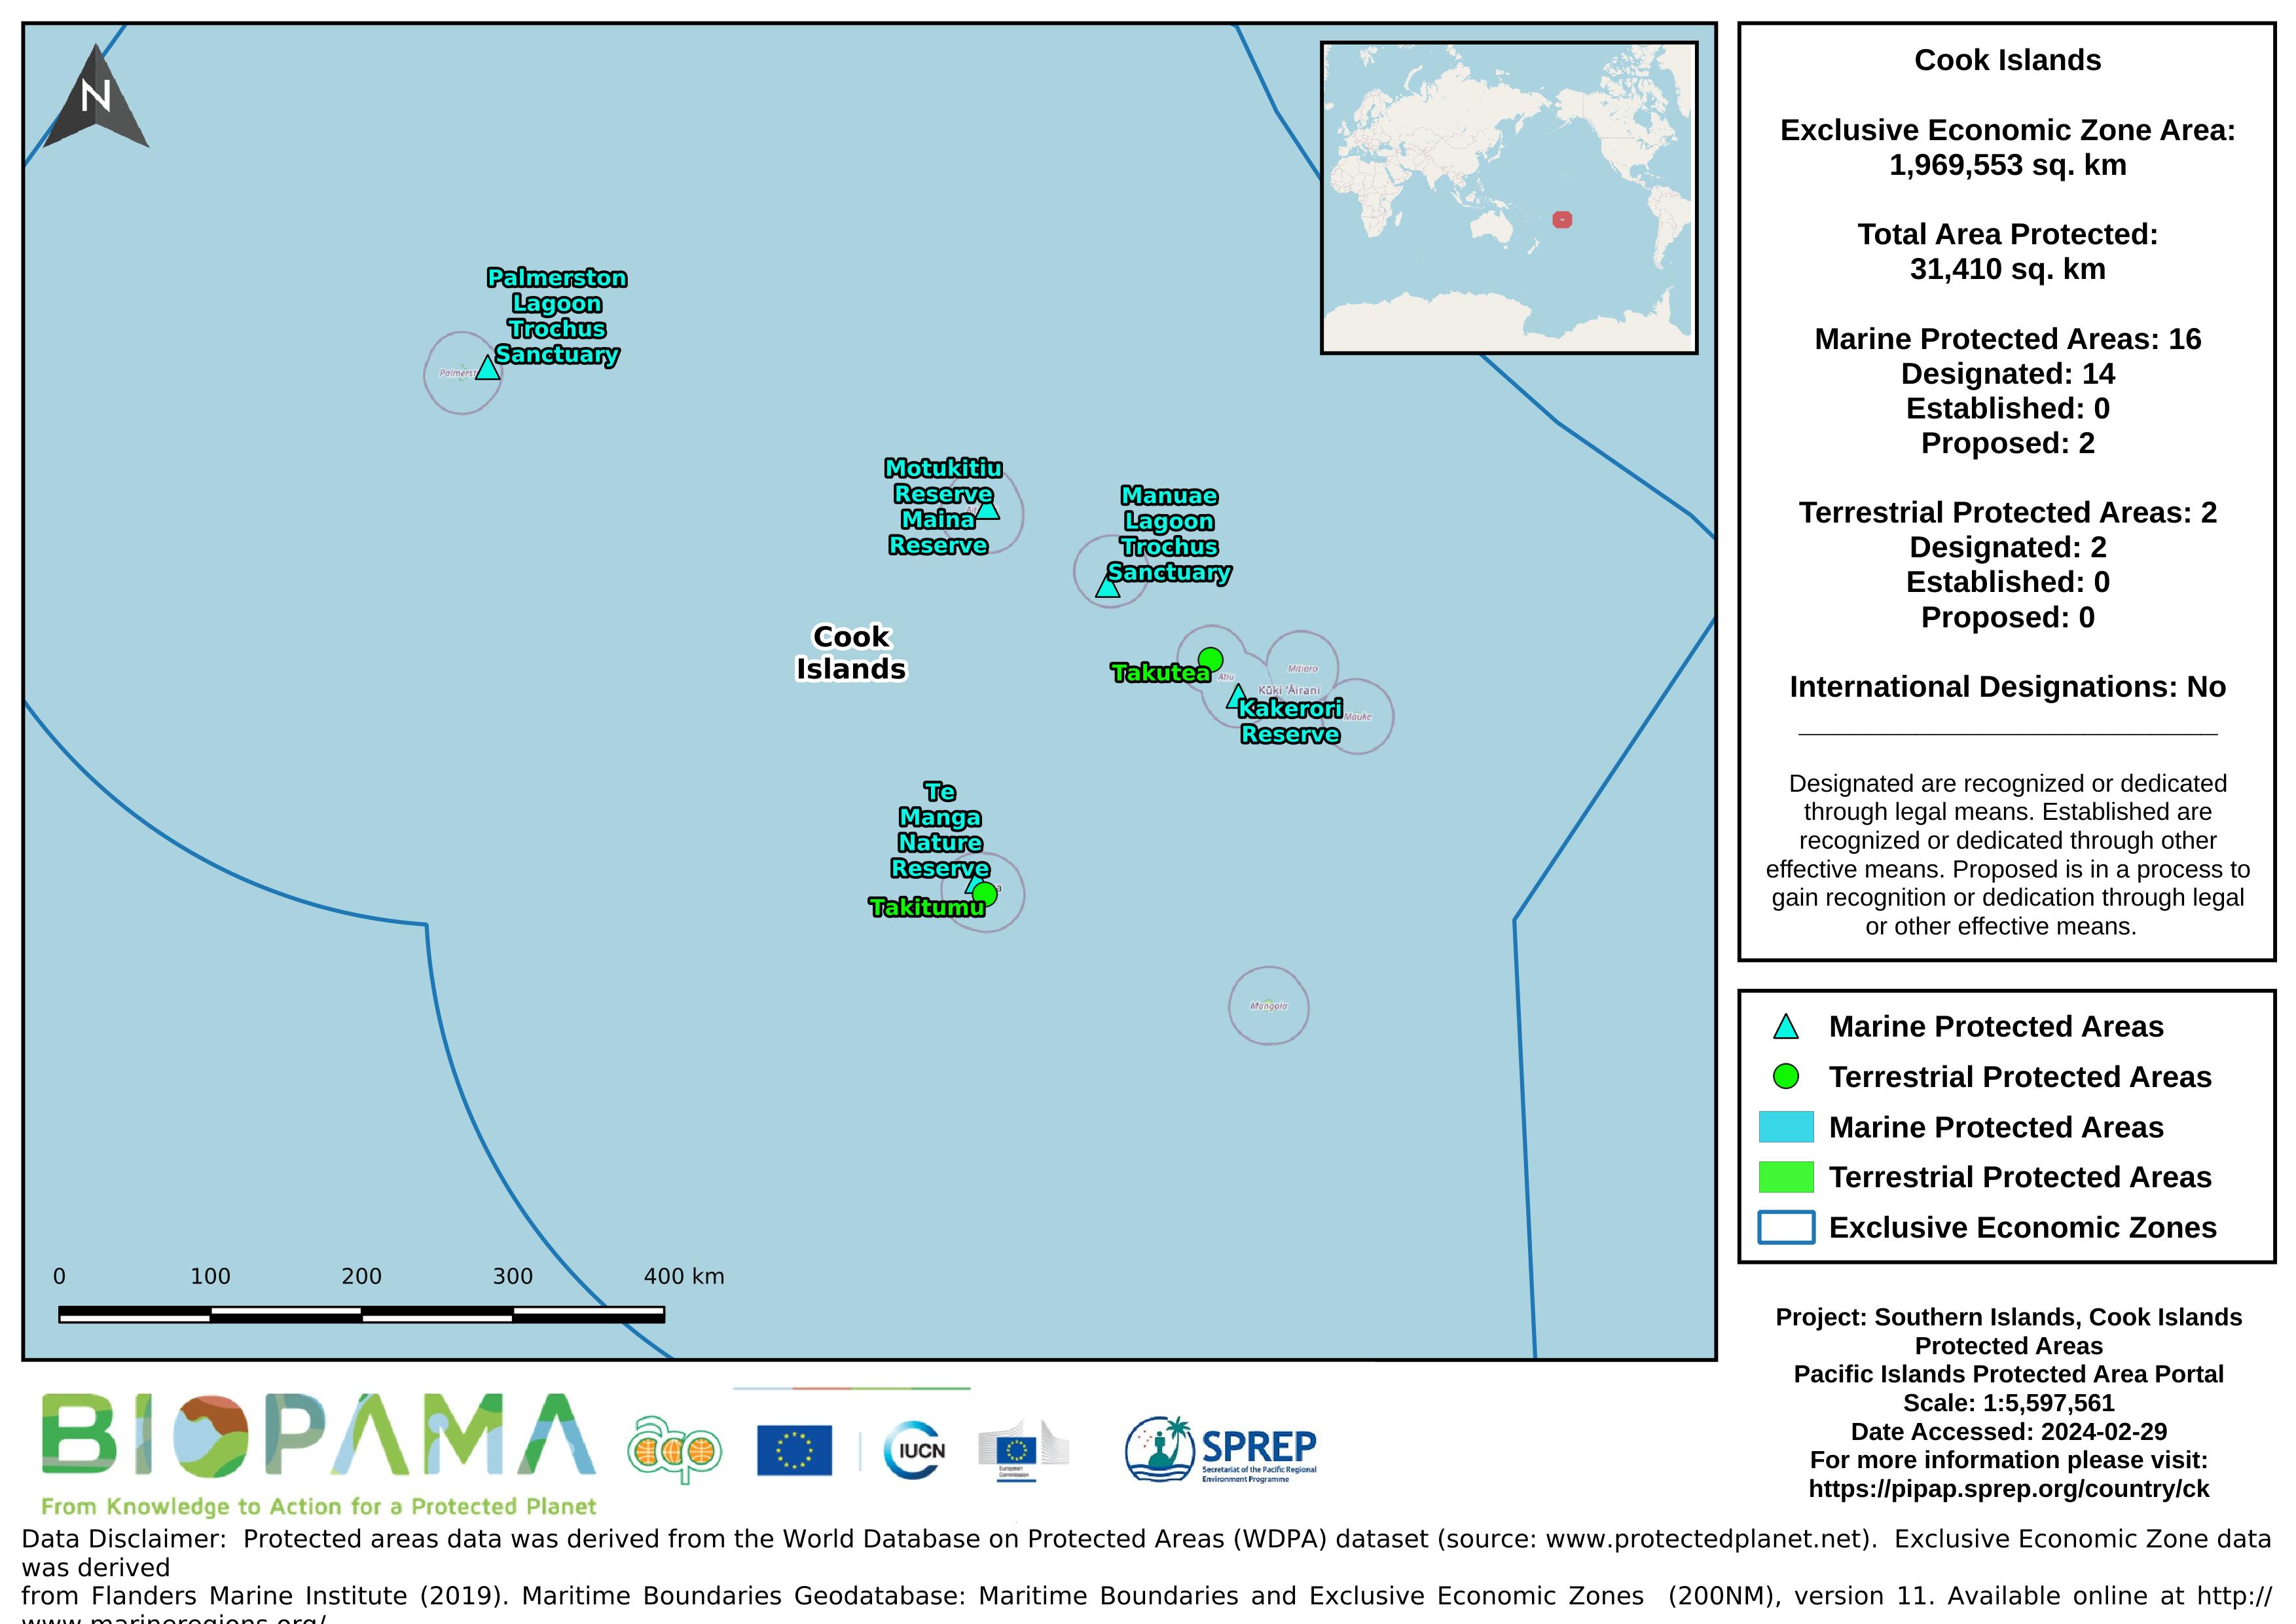
Map of the protected areas for Southern Islands, Cook Islands with country-level summary statistics on the amount of area under protection, count for each type of protected area (terrestrial or marine), and the count of their designation.
There are 14 terrestrial PAs, which total at least 1407.2 hectares (five PAs are uncalculated), or about six per cent of the Cook Islands’ total 240 km2 land mass. Terrestrial PA are concentrated in a few locations. Three of the 15 islands in Cook Islands are wildlife reserves (Suwarrow, Takutea and Manuae), almost 40% of the terrestrial PAs are represented by four motu on Pukapuka, and three of Rarotonga’s four PAs make up 36% of total terrestrial PAs.
Bio-ORACLE is a set of GIS rasters providing geophysical, biotic and environmental data for surface and benthic marine realms. The data are available for global-scale applications at a spatial resolution of 5 arcmin (approximately 9.2 km at the equator).
Linking biodiversity occurrence data to the physical and biotic environment provides a framework to formulate hypotheses about the ecological processes governing spatial and temporal patterns in biodiversity, which can be useful for marine ecosystem management and conservation.
Raster data representing the mean levels of calcite in µmol/m3 for the surface water layer. The data are available for global-scale applications at a spatial resolution of 5 arcmin (approximately 9.2 km at the equator).
Marine data layers for present conditions were produced with climate data describing monthly averages for the period 2000–2014, obtained from pre-processed global ocean re-analyses combining satellite and in situ observations at regular two- and three-dimensional spatial grids.
Raster data representing the mean levels of current velocities in meters/second for the surface water layer. The data are available for global-scale applications at a spatial resolution of 5 arcmin (approximately 9.2 km at the equator).
Marine data layers for present conditions were produced with climate data describing monthly averages for the period 2000–2014, obtained from pre-processed global ocean re-analyses combining satellite and in situ observations at regular two- and three-dimensional spatial grids.
Raster data representing the mean levels of iron in µmol/m3 for the surface water layer. The data are available for global-scale applications at a spatial resolution of 5 arcmin (approximately 9.2 km at the equator).
Marine data layers for present conditions were produced with climate data describing monthly averages for the period 2000–2014, obtained from pre-processed global ocean re-analyses combining satellite and in situ observations at regular two- and three-dimensional spatial grids.
Raster data representing the mean levels of pH for the surface water layer. The data are available for global-scale applications at a spatial resolution of 5 arcmin (approximately 9.2 km at the equator).
Marine data layers for present conditions were produced with climate data describing monthly averages for the period 2000–2014, obtained from pre-processed global ocean re-analyses combining satellite and in situ observations at regular two- and three-dimensional spatial grids.
Raster data representing the mean levels of photosynthetically active radiation (PAR) in E/m2/year for the surface water layer. The data are available for global-scale applications at a spatial resolution of 5 arcmin (approximately 9.2 km at the equator).
Marine data layers for present conditions were produced with climate data describing monthly averages for the period 2000–2014, obtained from pre-processed global ocean re-analyses combining satellite and in situ observations at regular two- and three-dimensional spatial grids.
These interactive graphs were derived from the raw data of the Waste Audit conducted under the PacWaste Project for Cook Islands
The World Database on Protected Areas (WDPA) is the most comprehensive global database of marine and terrestrial protected areas, updated on a monthly basis, and is one of the key global biodiversity data sets being widely used by scientists, businesses, governments, International secretariats and others to inform planning, policy decisions and management.