The SPREP ID map is a high resolution (1MB) that shows SPREP member countries with their Exclusive Economic Zone (EEZ) boundaries developed by the GIS team at SPREP.
The SPREP ID map is low resolution (200KB) that shows SPREP member countries with their Exclusive Economic Zone (EEZ) boundaries developed by the GIS team at SPREP.
The map is high resolution showing SPREP member countries' Exclusive Economic Zone (EEZ) boundaries overlaid on a bathymetric base layer that was developed by the GIS team at SPREP.
The map is low resolution showing SPREP member countries' Exclusive Economic Zone (EEZ) boundaries overlaid on a bathymetric base layer that was developed by the GIS team at SPREP.
WMS API endpoint. For integrating with web based mapping and desktop GIS tools such as QGIS and ArcGIS.
First published at http://geonode.emci.gov.ck/layers/geonode%3Arar_lu_2009
The dataset contains a range of different Pacific regional maps developed by the SPREP GIS team and is available for use by members and partners.
Map of the protected areas for the Pacific Islands Region with regional-level summary statistics on the amount of area under protection, count for each type of protected area (terrestrial or marine), and the count of their designation.
The World Database on Protected Areas (WDPA) is the most comprehensive global database of marine and terrestrial protected areas, updated on a monthly basis, and is one of the key global biodiversity data sets being widely used by scientists, businesses, governments, International secretariats and others to inform planning, policy decisions and management. The WDPA is a joint project between UN Environment and the International Union for Conservation of Nature (IUCN).
The World Database on Protected Areas (WDPA) is the most comprehensive global database of marine and terrestrial protected areas, updated on a monthly basis, and is one of the key global biodiversity data sets being widely used by scientists, businesses, governments, International secretariats and others to inform planning, policy decisions and management.
The Landuse layer of Rarotonga was produced in 2009/2010 under the Sustainable Land Management (SLM) Project. This project was co-implemented by NES and MOIP.
The layer was produced by digitizing from satellite imagery and carrying out random checks on the field.
Map of the protected areas for Cook Islands with country-level summary statistics on the amount of area under protection, count for each type of protected area (terrestrial or marine), and the count of their designation.
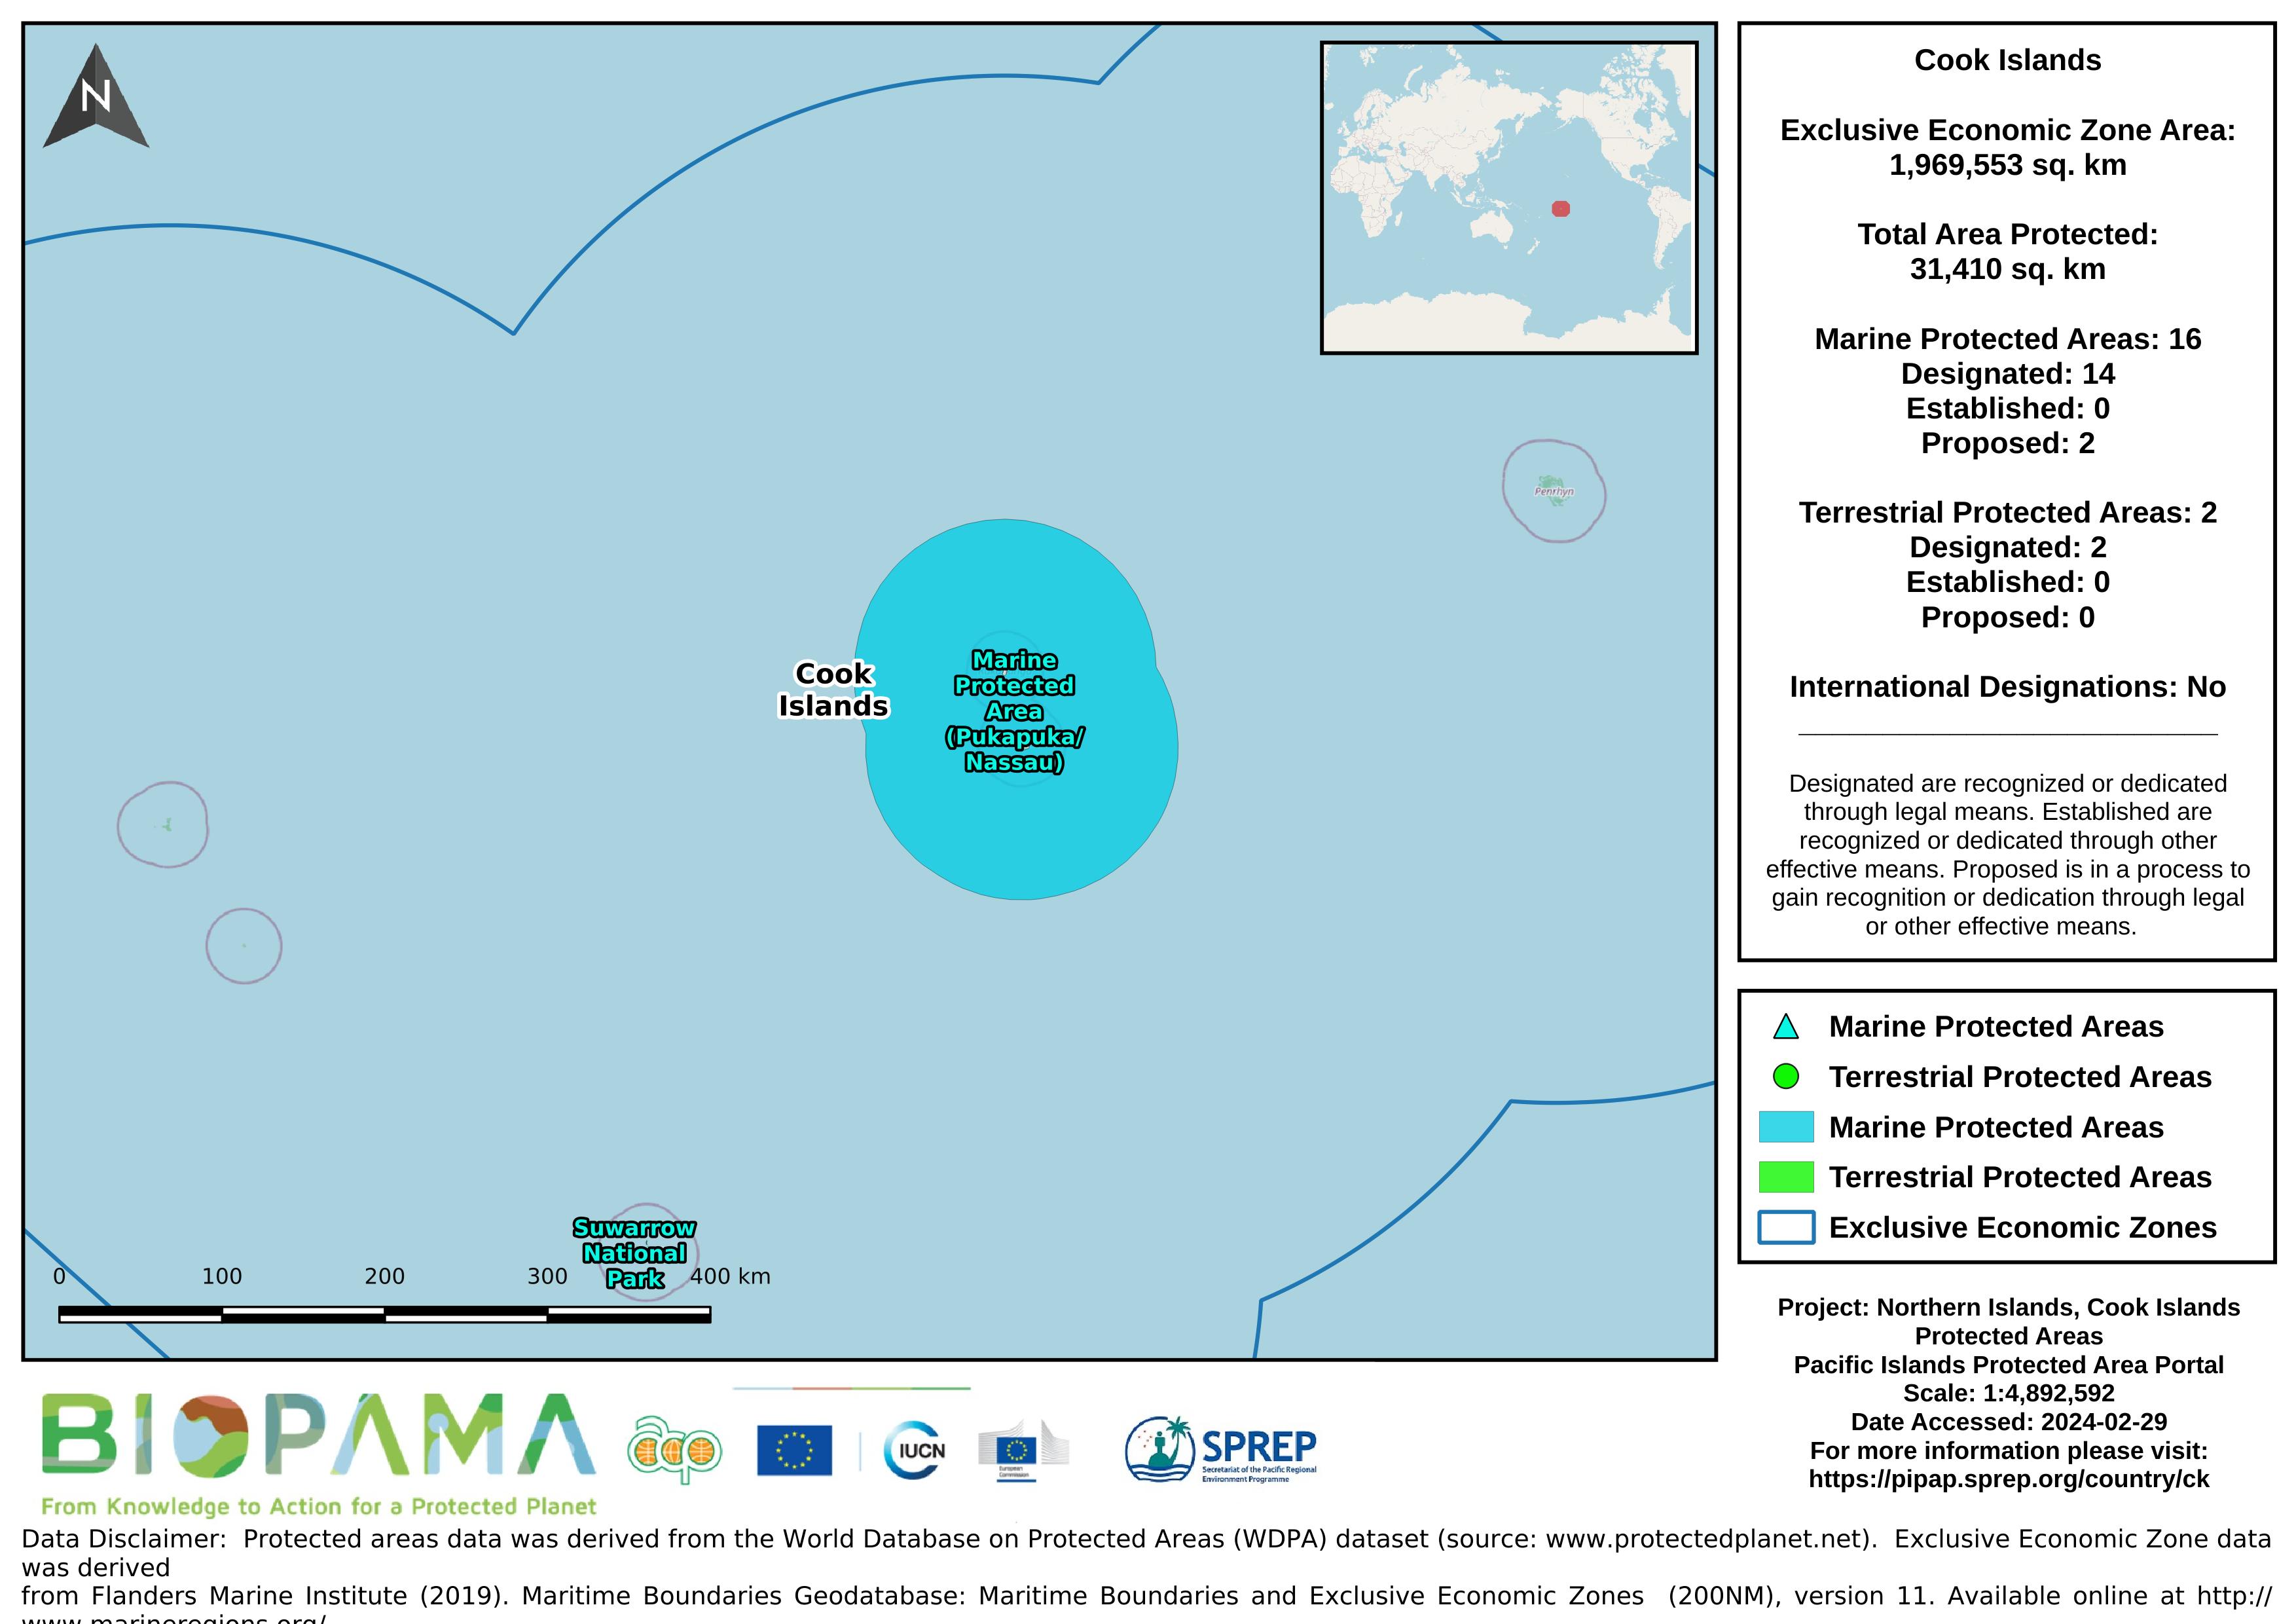
Map of the protected areas for Northern Islands, Cook Islands with country-level summary statistics on the amount of area under protection, count for each type of protected area (terrestrial or marine), and the count of their designation.
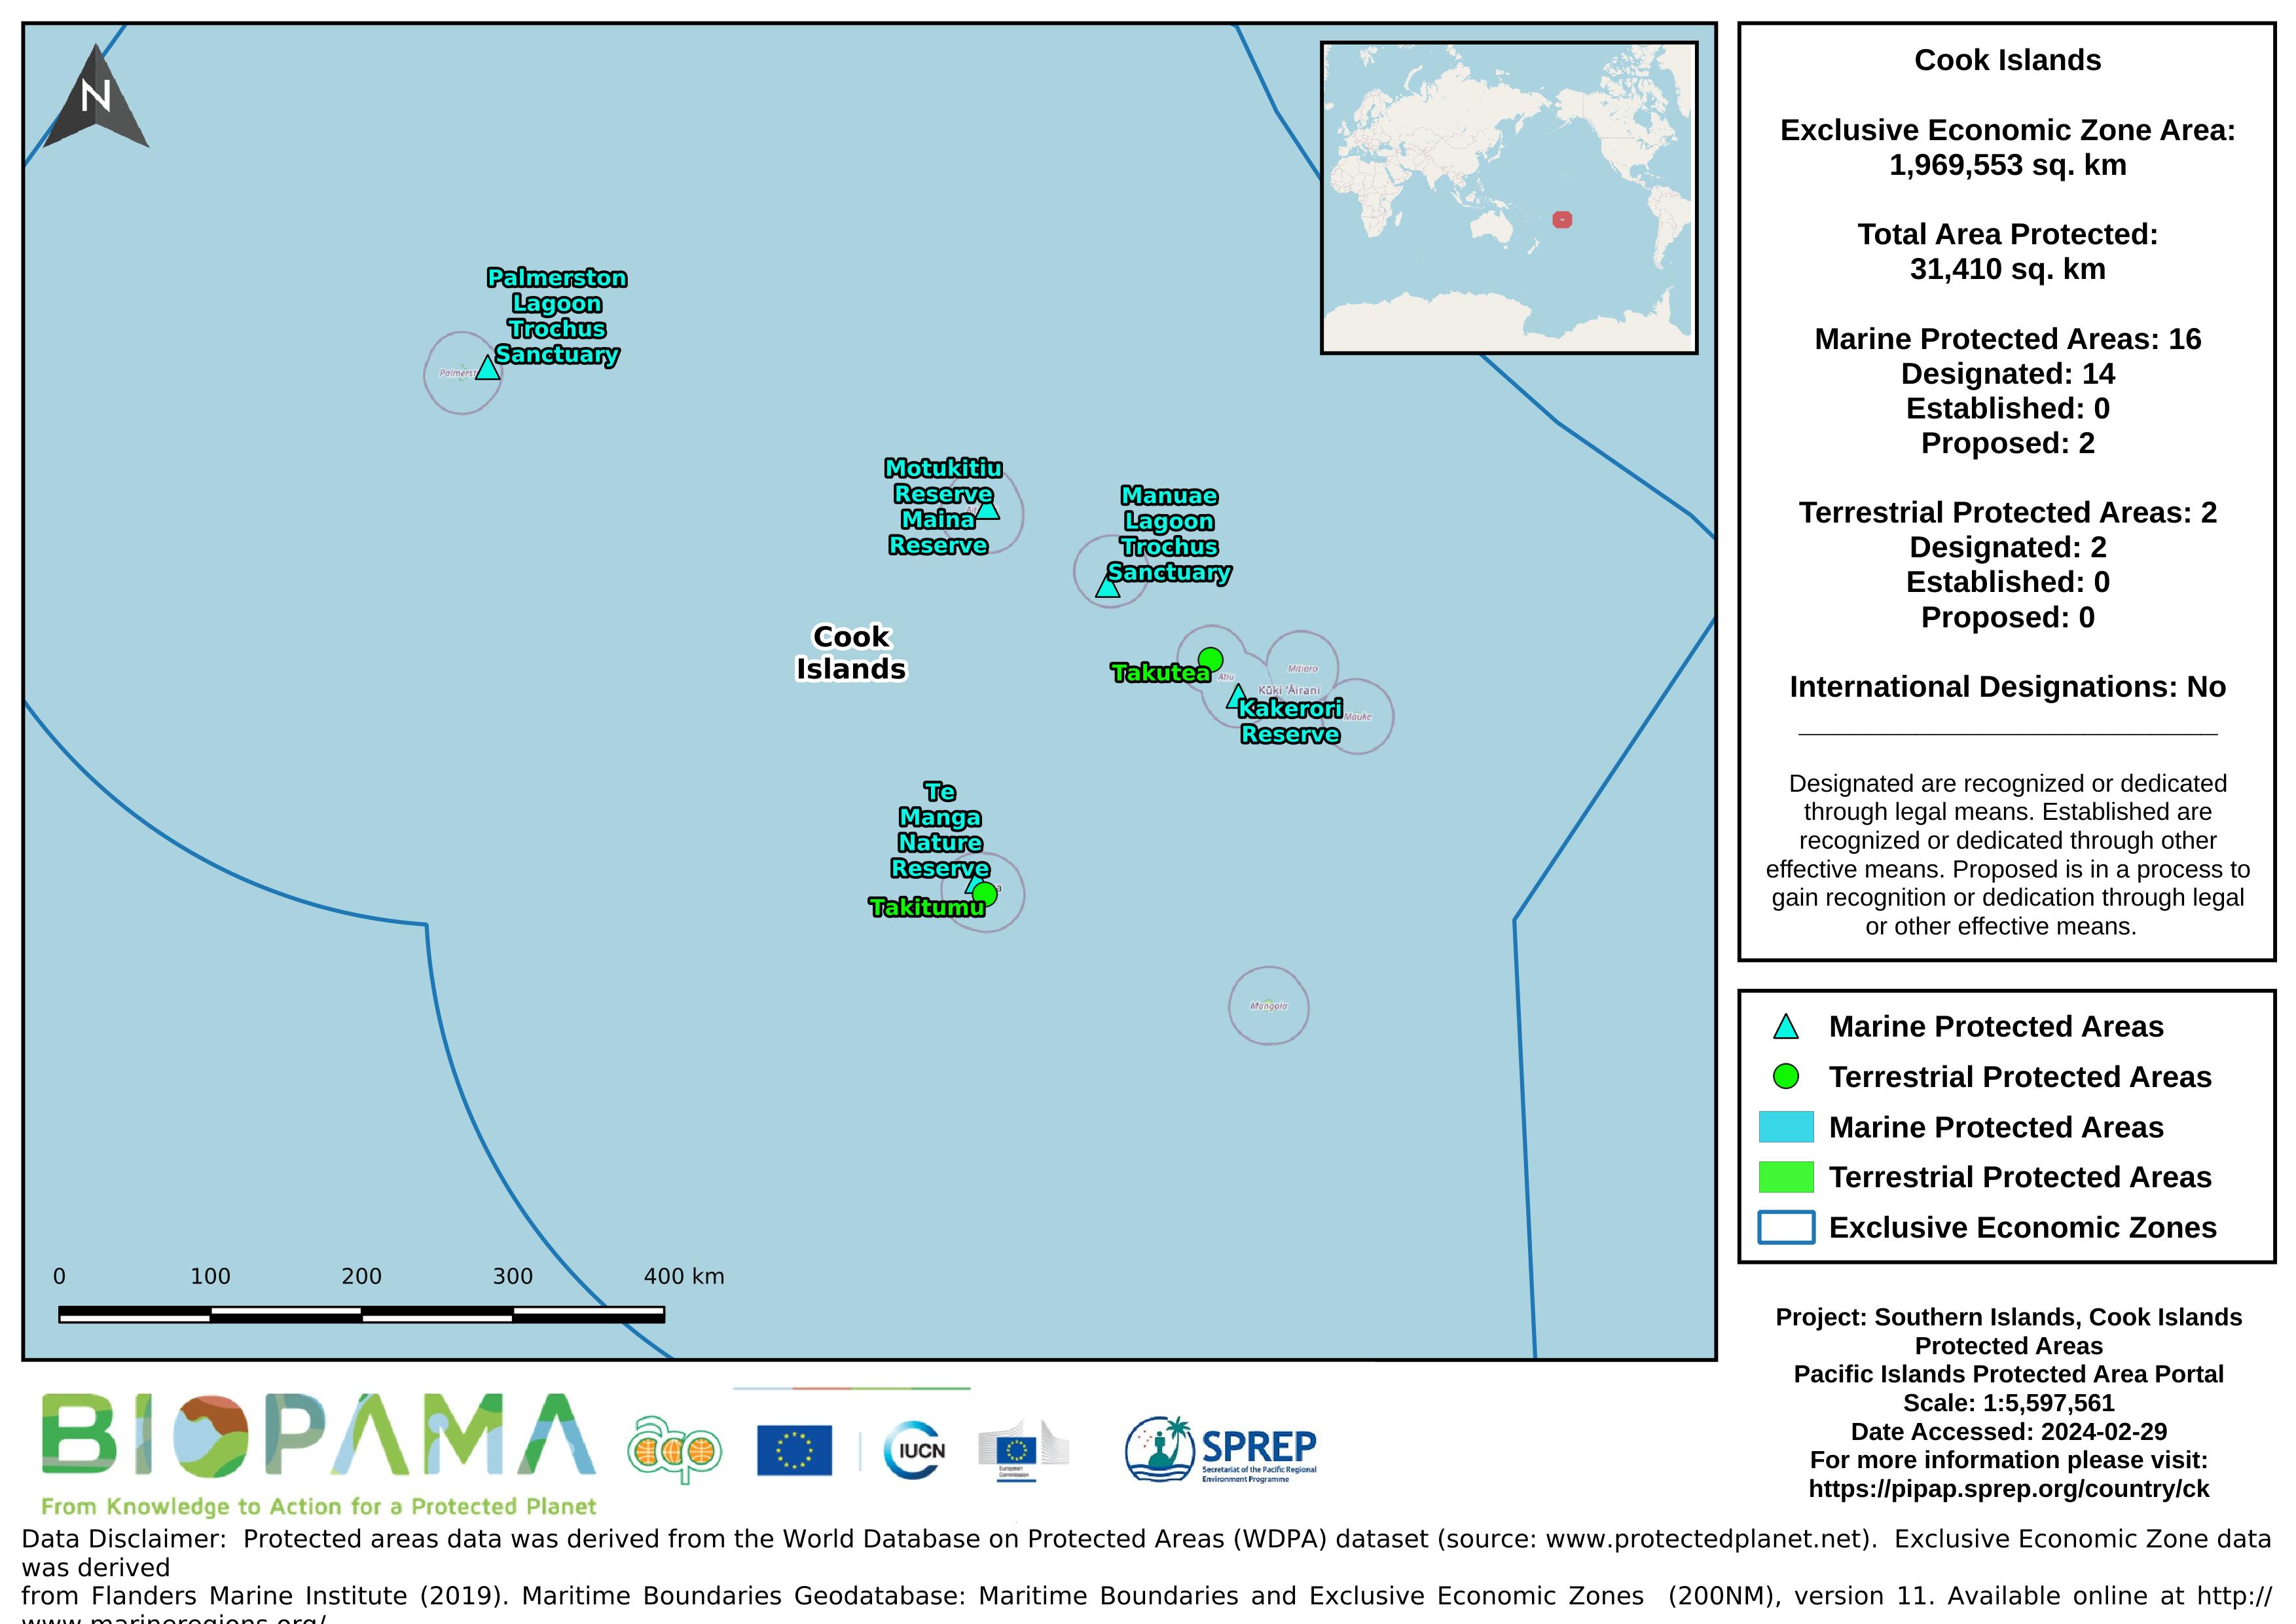
Map of the protected areas for Southern Islands, Cook Islands with country-level summary statistics on the amount of area under protection, count for each type of protected area (terrestrial or marine), and the count of their designation.